


Recruit People to Take Your Surveys
A Vendor Guide
Every technique I’ve used to recruit shoppers — accurately, quickly, and affordably — for ecomm brands, agencies, and Fortune 500s.
Table of Contents
Intro
Who’s this guide for?
What I mean when I say “Market Survey.”
Easy-to-leverage recommendations.
Ever wonder what kind of people take surveys?
Part 1: Defining the Population You Want to Sample
Define the basic demographics of the population you're sampling from.
Find the size of the population you’re sampling
Determine the composition of the population you’re sampling
Calculate sample size & margin of error
Comparing your customer base to the US Census
Resources you can use to define and size populations
Spotting trends over precision: a note on accuracy
Pro Tip I: Get your age brackets right
Pro Tip II: When to survey “Households” vs. “Individuals”
Pro Tip III: Resources and industry reports for segments not measured by federal agencies
Final Thought
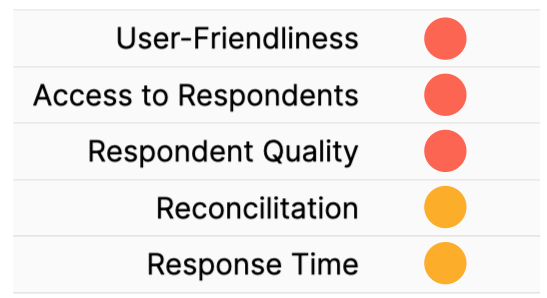
Part 2: Survey Respondent Recruitment Vendors
Fully self-serve
Semi-self-serve with support (w/my recommendations)
Assisted quote-based
Licensed services
Survey platforms with built-in panel services: a warning
Besides sample size, what determines the respondent fee?
Tip I: Use open text response to catch bad respondents
Tip II: Watch out for fee structures that charge per response
Tip III: Understand what “proprietary panel” means
Final Thought
Intro
“How do you get people to take your surveys?”
I get this question a lot.
The short answer is that I pay them.
But keep reading.
Even if you've never wondered about how survey data is collecting, getting the inside scoop on recruitment will help you:
🌎 Reach millions of shoppers
💵 Save you thousands in fees
🔍 Understand the science behind polling
Who’s the guide for?
Have you ever:
➡️ Tried DIY a survey but ended up overwhelmed and without any useful insights?
➡️ Polled friends & family only to realize the data wasn’t reliable?
➡️ Hired a vendor and felt you overpaid for data that lacked value?
You're here because you're searching for a better way to understand consumers.
Or maybe you’re just interested in surveys and shopper psychology.
Either way…
Conducting a market survey is like fixing a leaky faucet – it’s important and not that complicated, yet so frustrating that you end up overpaying for a professional.
The guide provides practical tips that help you “fix the leak.”
That way, you can get shopper insights without having to rely on unsubstantiated desktop research, underwhelming social listening tools, or survey templates that put people to sleep faster than a Noam Chomsky lecture.
What I mean when I say “Market Survey”
In this guide I talk about market surveys or "polls"— not in-app user surveys, customer feedback surveys, or post-purchase surveys. (Each of those involve engaging customers directly onsite or blasting a list of subscribers.)
A “market survey” is about measuring populations. It involves representative samples — for example “females aged 18-34 based in the United States”.
This guide contains two parts:
Part I: Defining the population you want to sample
Part II: Recruiting people from that population
If you just want the key takeaway for Part I and Part II, scroll until you reach “🧠 Final Thought.”
Otherwise let’s keep going…
Ever wonder what kind of people take surveys?
It’s another question I hear a lot.
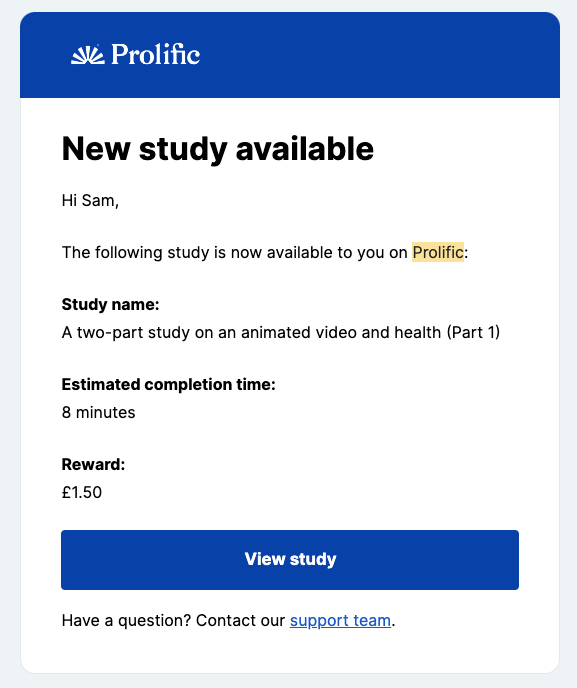
Millions of people join panels to receive direct payments or earn "coins" or "points" for an app or game. I’ve done both myself. A few times a week, I get an email with a chance to take a survey (see image). These emails usually tell you the survey's title, estimated completion time, and the reward.
Part 1: Defining the Population You Want to Sample
Before recruiting respondents for a survey, you’ll need to…
Define the demographics of the population you're sampling from
By "define the demographics" I mean select verifiable metrics such as age and gender, which you can access through resources like Census.gov.
For example:
✅ 18-34 year olds residing in the United States
❌ Gen Z and Young Millennials
The first line gets the green check because it uses age brackets used by the U.S. Census (more on that in a second).
After you’ve defined the demographics, you’ll need to find the size of the base population you’re sampling.
Find the size of the population you’re sampling

Let’s stick with 18-34 year olds living the US.
According to the Census, the base population of 18-34 year olds in the United States is 75 million.
75 million is derived by adding the population of 20-34 year-olds and subtracting the 20-24 group from the 18-24 group, a necessary adjustment due to the age brackets starting at 15-19 instead of 18. (Combining data from different categories like this is common.)
Determine the composition of the population you’re sampling

In terms of18-34 year olds in the US, you can safely assume the gender ratio will be 50/50. But the number of individuals for each specific age might vary. Using data from a population pyramid like this one, you can create quotas based on the population of each age.
I've sampled this segment before, so I know there are peaks at ages 22 and 23, followed by a dip, and then peaks again at 33 and 34 (pictured).
Calculate sample size & margin of error

To find the right sample size, enter your target population into a sample size calculator (pictured).
For strategic tasks like defining markets, I typically use a sample size of 1,100 to achieve a ±3% margin of error, ensuring both precision and that segmented samples remain adequately large.
For testing creative concepts and messaging, a smaller sample size is sufficient, since the goal is to detect significant differences rather than to generalize to a broader population.
Comparing your customer base to the US Census

Got demographic data that aligns with Census metrics? You can easily compare your customer base to the general population.
For example, after surveying customers for one client, I discovered they were predominantly aged between 30 and 40—significantly older than the intended target demographic of 18 to 30 year olds (picture).
Resources you can use to define and size populations
The information provided here is specific to the United States. If you're based in a different country, you should reference your own national census data.

Census.gov
Basic demographics

Consumer Financial Protection Bureau
Spending habits and financial well-being

Bureau of Labor Statistics
Employment and income statistics

CDC
Health statistics

Social Security Administration
First names
Data.gov
Huge database of all publicly available datasets
Zip Code Database
Demographics split city, state, MSA
(Paid & free versions)
🎯 Spotting trends over precision: a note on accuracy
This guide is crafted for marketers, not pollsters or policymakers. It prioritizes detecting significant shifts, trends, and consumer preferences, without getting bogged down in the excessive precision often sought by pollsters—precision that can lead to inefficiencies and unnecessary detail.
Tip I: Get your age brackets right
A common mistake is using age brackets that don’t align with those used by the US Census. For accurate comparisons to the broader population, use the age brackets under the green checkmark.

Tip II: When to survey “Households” vs. “Individuals”
Are you targeting households or individuals? For products used by the entire household, such as air purifiers or a Netflix subscription, consider your audience as households. For personal items like toothbrushes, your focus should be on individuals.
To give you an idea of scale, there are approximately 130 million households and 333 million individuals in the United States.
Tip III: Resources and industry reports for segments not measured by federal agencies
If you need to target a specific segment, like daily Vitamin C users or Tesla owners, which isn't directly tracked by census data, your best approach is to search for existing studies or industry reports. For example, for a fintech client, I often use Plaid’s "The Fintech Effect" report to understand how many people regularly use savings and budgeting apps.
Start with the main demographic factors, then incorporate insights from these resources to refine your sample. Below are some valuable resources to consider.

Harris Poll’s “News & Events”
YouGov
Measuring political party affiliation

Gallup “Front Page”

🧠 Final Thought
I know it seems like a lot.
But it's actually quite straightforward: Just be clear and specific about your target demographic, and avoid catchy, vague segments like "Urban go-getters.”
Step 1: Define verifiable demographics, such as age and gender, aligned with U.S. Census data.
Step 2: Determine the size of the population you’re sampling.
Step 3: Adjust survey quotas based on the composition of the target sample.
Got it?
Great!
Now let’s move onto Part II.
⬇️ ⬇️ ⬇️ ⬇️ ⬇️ ⬇️
Part 2: Survey Respondent Recruitment Vendors (A Guide)
This vendor list prioritizes self-service options because I prefer as much autonomy as possible. Also, they’re more cost-effective than the alternatives, which pair you with an analyst.
Self-service isn't overly complex and can lead to significant savings if you're willing to invest a bit of time.
Fully Self-Serve
Manage everything from payment to interaction with respondents.
Amazon Mechanical Turk
Price: $$$
Service Reps: ❌

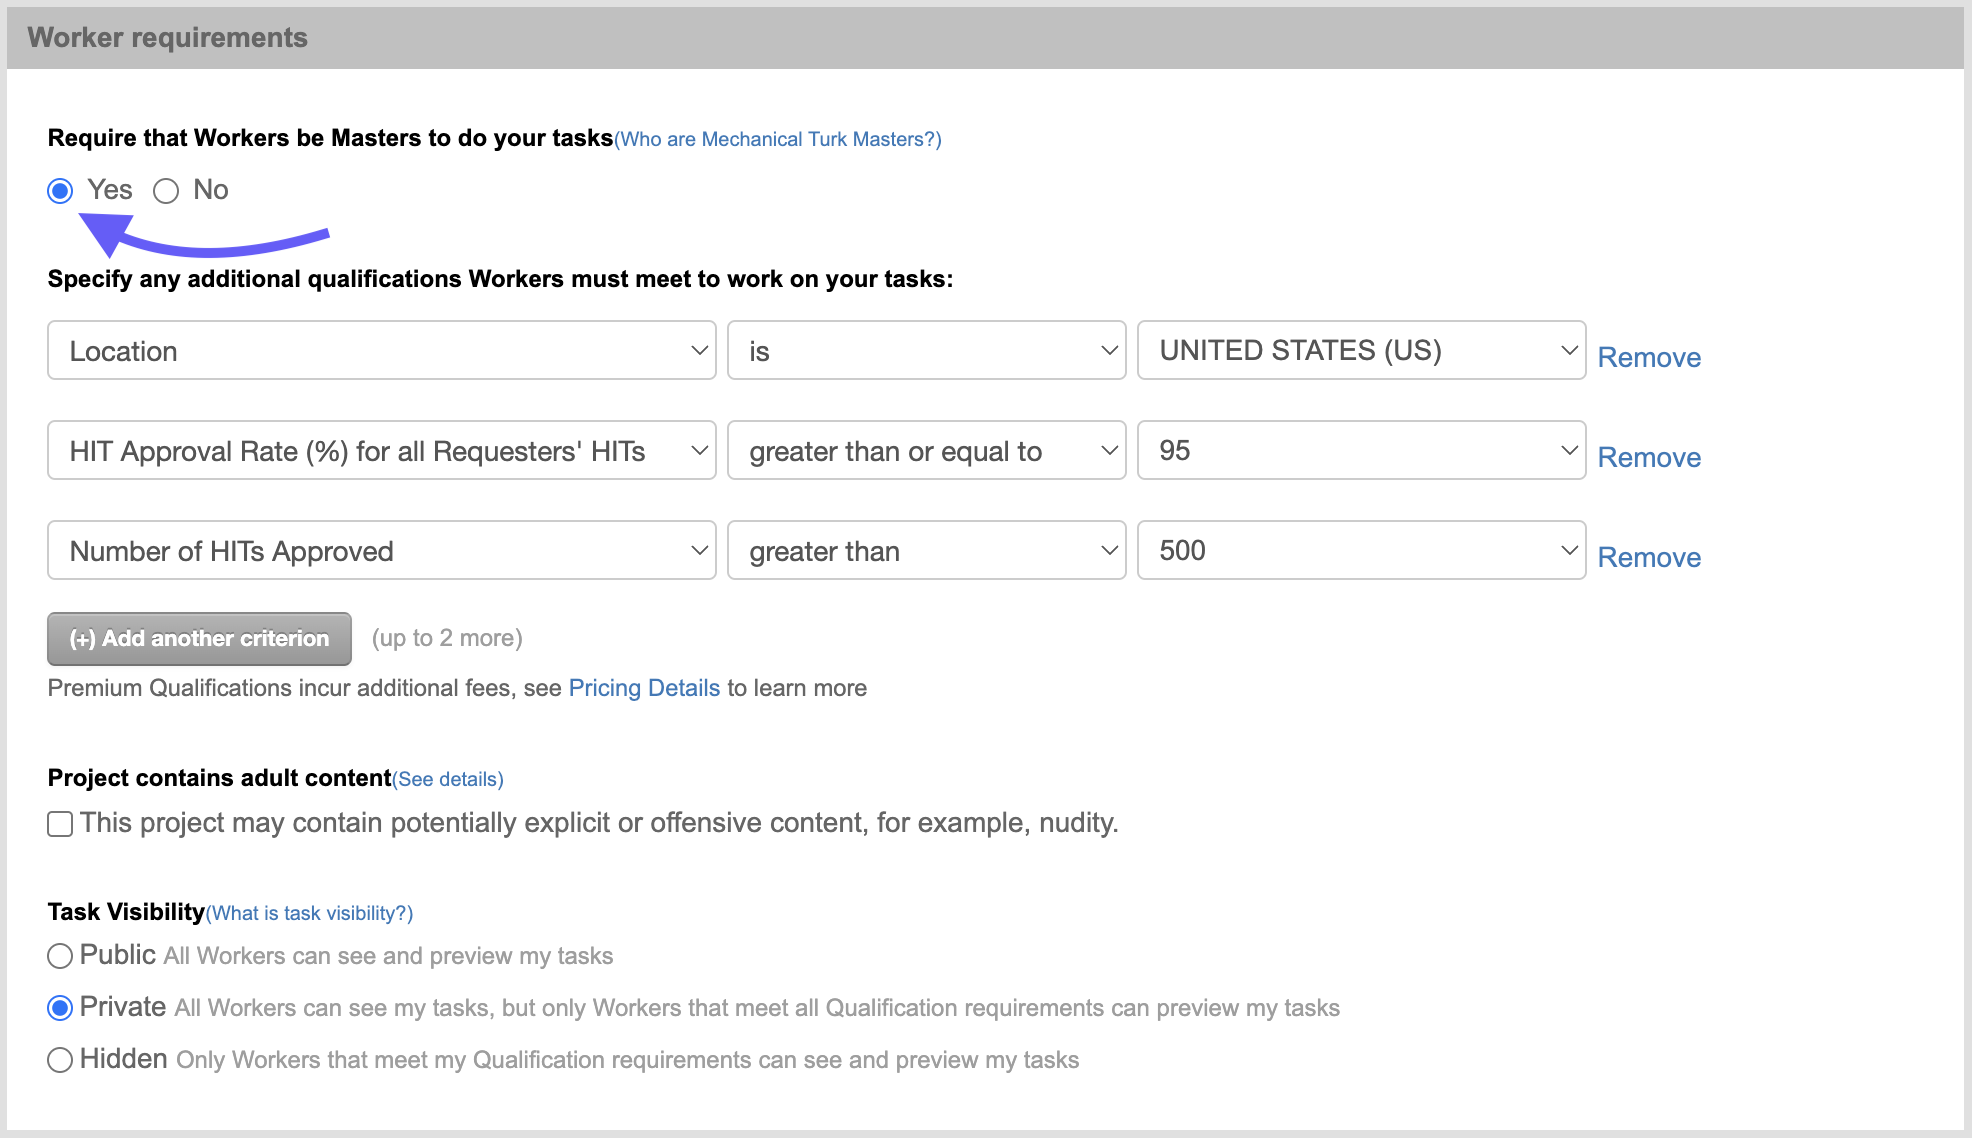
Amazon Mechanical Turk is the Wild West of recruitment vendors. It's filled with bots. The interface feels like early 2000s Internet. Yet it offers unparalleled speed and cost-effectiveness. You set the price directly and if a respondent has an issue, they reach out to you directly.
I use Turk to test surveys (on samples of ~20 respondents). It’s a great way to gauge what works and what doesn’t before pressing go on the full data collection. This “rapid prototyping” is unbelievably helpful, and a massively upgrade over collecting data on your first attempt.

Tip: Require that workers be 'Masters' for your tasks. You pay extra but it’s worth it. You’ll spend much less time weeding out bots and bad responses.
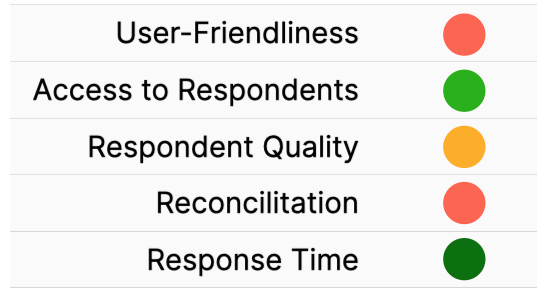
Prolific
Price: $$$*
Service Reps: ❌

Originally designed for academics, Prolific focuses on representative samples from the general population rather than specific shopper segments. It lacks the scale of the big vendors like CINT, but it’s seamless interface and affordable pricing structure makes it great overall resource.
A notable pricing caveat is that you must compensate respondents who don’t qualify for your specific criteria (e.g., like Ford car owners). This differs from most platforms, which charge based on the percentage of qualifying respondents.
Like Turk, you set the price and communicate with respondents directly. Don’t set it too low because data collection will drag.

Semi Self-Serve
Self-serve portal to submit sample needs, then assisted by an analyst. Payment made via invoice.
CINT
Price: $$$
Service Reps: ✅


For most projects CINT is the best all-around choice, claiming access to over 335 million respondents. While this number is probably hugely inflated, its large scale is undeniable. The platform includes a user-friendly self-serve portal and an API that integrates with Census data, making it easy to set age and gender quotas.
As a panel aggregator, CINT operates much like Airbnb for renters or Uber for drivers, connecting a vast array of panels.
However, I wish the data quality was better. If you use CINT, make sure you add open-text questions to you survey so can identify and eliminate bots and low-quality respondents.

Pure Spectrum
Price: $$$
Service Reps: ✅
PureSpectrum is a direct competitor to CINT, and I’ve found their overall output to be acceptable from the few times I've used them.
However, their interface is a major drawback; it's not user-friendly, requiring the consultation of several PDFs to understand how to link with my survey platform. The reconciliation process was equally frustrating.
Despite these issues, their prices are quite competitive, which, along with their reach, makes them a compelling option.
Assisted Quote-Based
Request a quote or book a call. The vendor provides pricing and coordination with a suitable supplier.
➡️ I’ve used all of these vendors at least once and would recommend any of them if you’re not looking for a self-serve or DIY approach.
Reach out to me directly if you need an introduction.
A quick tip: a vendor's call-to-action like "request a quote" or "book a demo" usually means higher costs and involvement with an analyst.
InnovateMR
They also provided B2B panels.

Centiment
Used them one. Pretty good.
RepData
Former Ludic guys. Started RepData to focus on quality.

Licensed Services
Book a call, purchase a seat or license to access services and respondent pools.
➡️ License survey services like Tracksuit, Suzy, and SightX typically operate on a subscription model, encouraging users to sign up for ongoing services.
This can be particularly valuable for businesses looking to stay consistently informed about their market and consumer trends — but these options will probably be the most expensive.
Tracksuit
Startup based in NZ, expanding to the US. Great for brand tracking.

Sago
(Formerly Schlesinger Group.)

Suzy
Expensive the last time I checked. Minimum $50k investment.
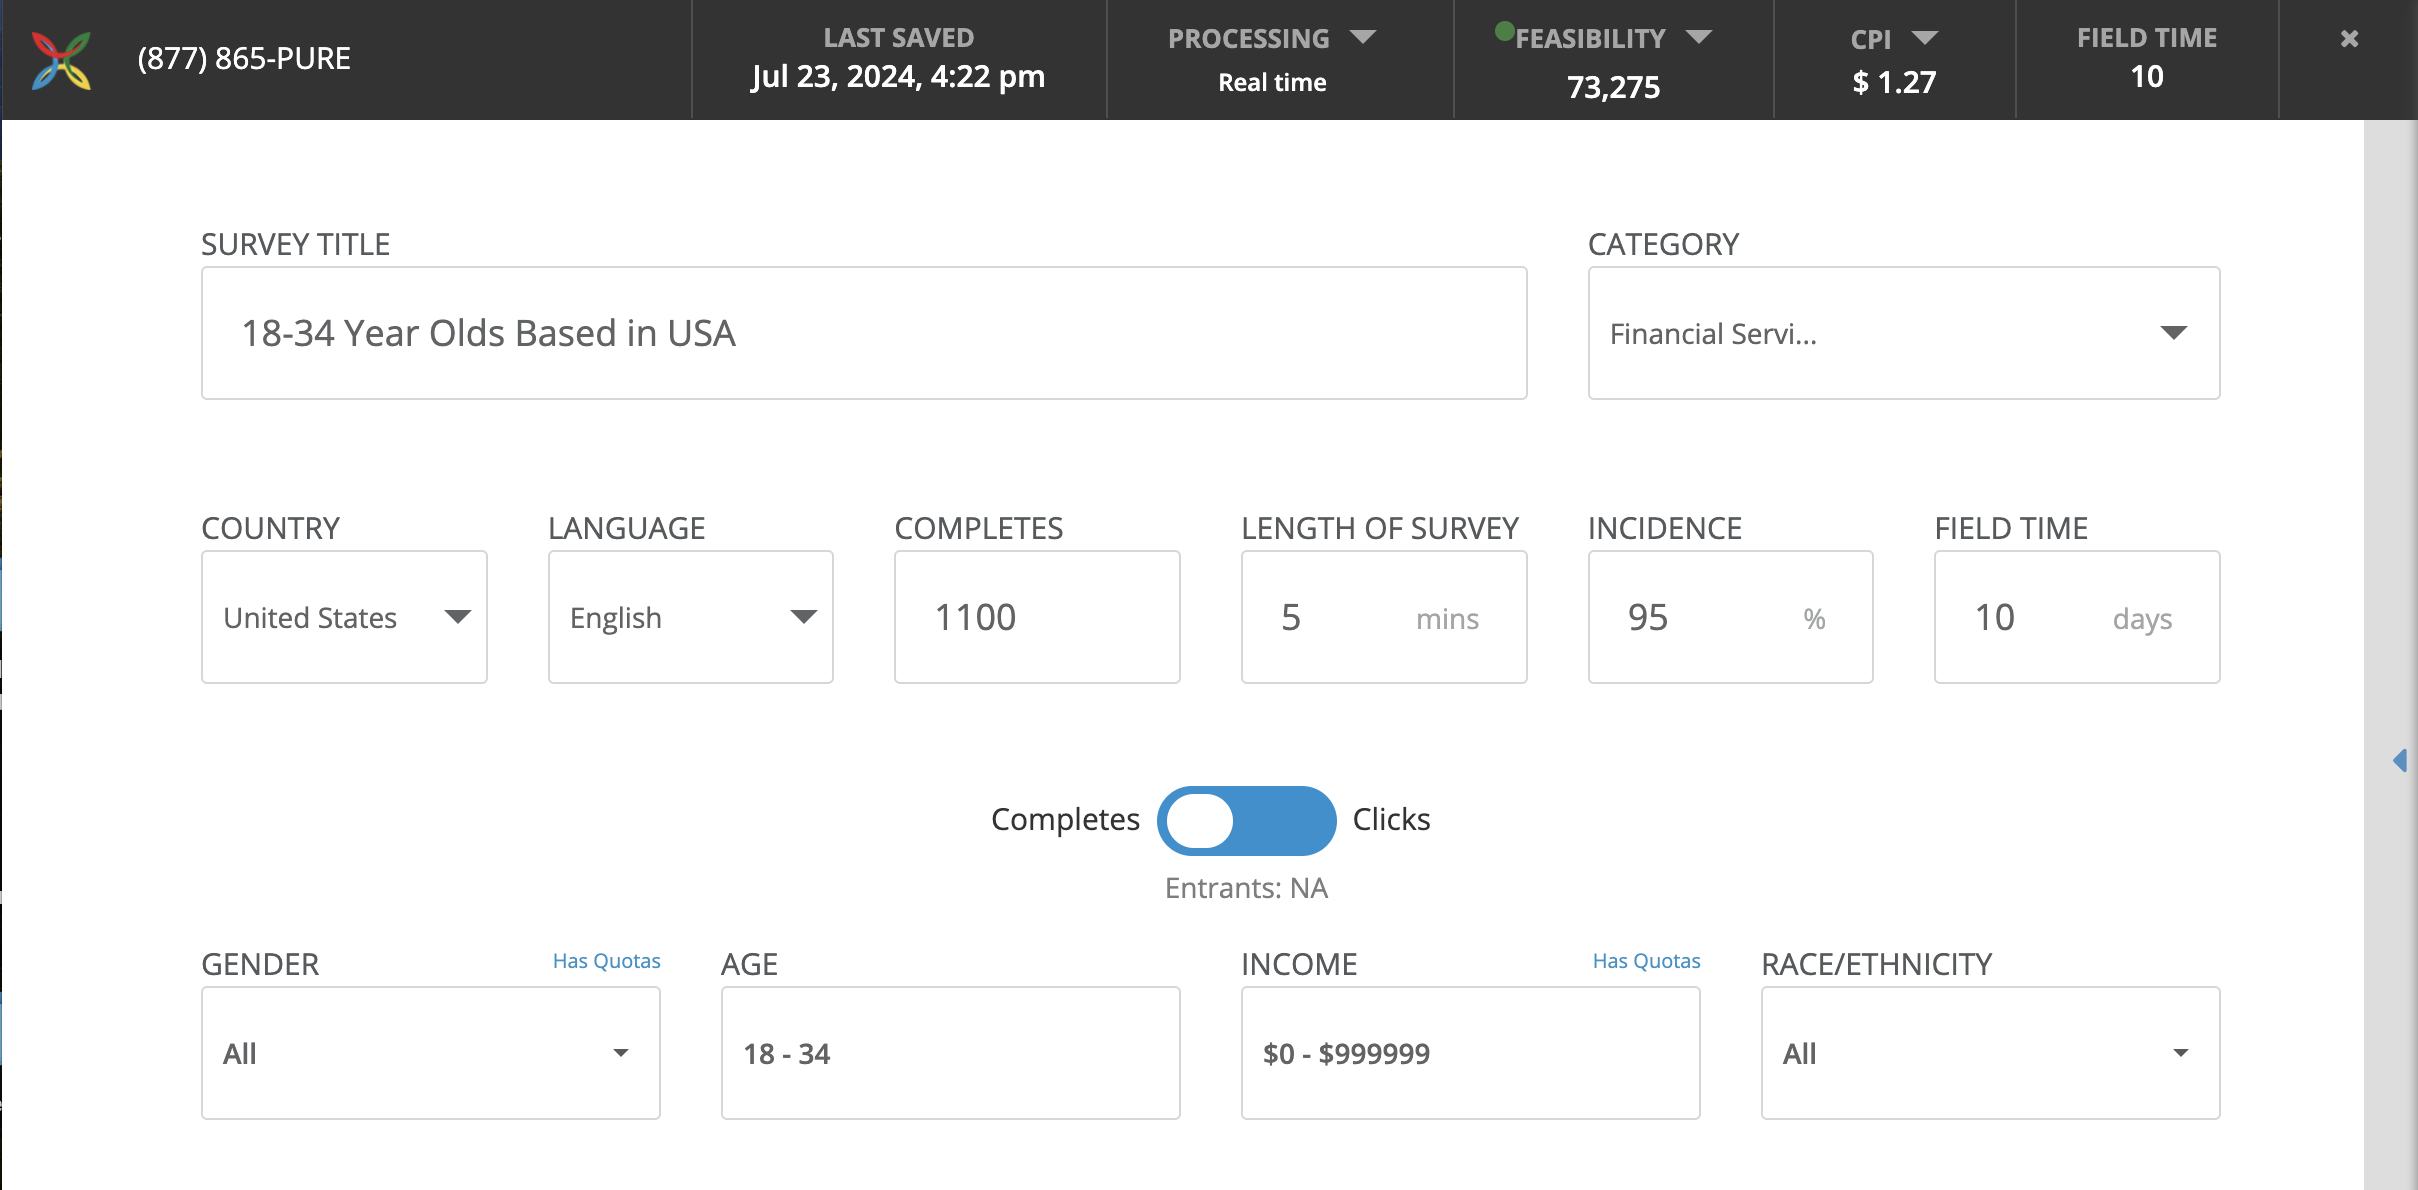
🚩 Warning: Survey platforms with built-in panel services
Survey platforms often provide portals for users to recruit respondents (picture). Be aware that they’re usually just white labelled APIs with CINT or other panel providers. Engage with vendors directly if you don’t want to pay pass-through costs.

Besides sample size, what determines the respondent fee?
Typically, the cost of sampling depends on the "Incidence Rate" (IR)—the size of your target population relative to the whole—and the "Length of Interview" (LOI). For instance, if you have an IR of 90% and an LOI of 3 minutes for 1,600 respondents, you might pay $2.00 each, totaling $3,200.
Niche samples and longer surveys will generally increase your costs.
Tip I: Use open text response to catch bad respondents
Regardless of the vendor you use, include open-text questions to help identify and weed out bots and low-quality respondents.
In this example (pictured), you can easily spot duplicate responses, gibberish, and irrelevant content.

Tip II: Watch out for fee structures that charge per response
Let’s say a survey platform charges $0.50 per response with an annual subscription of $25,000, providing 50,000 responses. They claim that they they "don't charge any premium for reaching more specific audiences.” While true, this model primarily benefits those needing niche samples for short surveys—an unlikely scenario.
Here’s a breakdown based on a real situation a previous client was faced with:
Option 1: Per Response Subscription
Number of Responses: 16,000 (1,600 people answering 10 questions)
Cost per Response: $.50
Total Fee: $8,000
Option 2: Alchemer (or similar) + CINT
Annual Subscription to Alchemer: $1,020
Number of Respondents: 1,600
Cost per Respondent: $1.36
Total Respondent Fee: $2,100
Total Fee: $3,120
Tip III: Understand what “proprietary panel” means
Many vendors boast exclusive, vetted respondent databases that supposedly enhance quality, and often, this is true. However, the real issue lies in the size of these panels. Frequently, vendors rely on these panels but also turn to external sample partners more often than not.
🧠 Final Thought
Okay that’s it!
Let’s summarize everything.
Do use demographic data effectively to target the right respondents.
Do select appropriate survey platforms and recruitment services that fit your project needs.
Do pay attention to fee structures and ensure the quality of respondents.
Don't overlook the importance of choosing the right recruitment vendor for quality data.
Got it?
Great!
Thanks so much for reading.

Sam McNerney
Founder, McNerney Insights & Marketing